
Authors & Year: Jeffrey D. Blume, Robert A. Greevy, Valerie F. Welty, Jeffrey R. Smith, and
William D. Dupont (2019)
Journal: The American Statistician [DOI: 10.1080/00031305.2018.1537893]
Review Prepared by David Han
A chronic conundrum of p-values
For centuries, the test of hypotheses has been one of the fundamental inferential concepts in statistics to guide the scientific community and to confirm one’s belief. The p-value has been a famous and universal metric to reject (or not to reject) a null hypothesis H0, which essentially denotes a common belief even without the experimental data. Technically, a p-value is the probability of obtaining test results at least as extreme as the result actually observed under the assumption that H0 is correct. A very small p-value means that such an extreme outcome would be very unlikely, and hence it provides quantifiable evidence to reject the null hypothesis. Reporting p-values has been customary in academic publications of many experiment-oriented disciplines such as natural science, engineering, and medicine. Since the precise meaning of the p-value is difficult to grasp, its misuse and abuse are widespread. Therefore, its utility as a sole indicator for scientific findings has been debated for decades. Although it has been a major topic in metascience, there has not been a definitive guideline yet since no metric has ever been as successful as the p-value to bestow scientific objectivity. Also, it is not easy to replace a century-old practice. To address the well-known imperfections of the classical p-value, Blume et al. (2019) recently proposed an extension, called the second-generation p-value, pδ that formally accounts for scientific relevance while still controlling the false positive error. Understanding its potential implications in many fields, the American Statistical Association (ASA) hosted the annual ASA Traveling Course in 2022, specifically on this topic (http://community.amstat.org/coc/chapterresources/travelingcourse/secondgenp-values).
What is the 2nd-gen p-value?
The second-generation p-value, pδ relies on a pre-specified null hypothesis H0 expressed as an interval. The subscript δ stands for this dependence, distinguishing the fresh version from the classical p-value. This interval is essentially a collection of the parameter values that are scientifically uninteresting, clinically unmeaningful, or practically null. Given this interval null hypothesis, the second-generation p-value is essentially the proportion of data-supported hypotheses that are null hypotheses; see Figure 1 for illustration. When pδ = 0, the data only support scientifically or clinically meaningful hypotheses (i.e., alternative hypotheses). When pδ = 1, the data only support (practically) null hypotheses. When pδ = 0.5, the situation becomes strictly inconclusive. Simply speaking, the second-generation p-value quantifies the degree of data compatibility with the null hypothesis. It is now widely available via commercial (e.g., STATA) and open-source software (e.g., R packages SGPVs and ProSGPV).
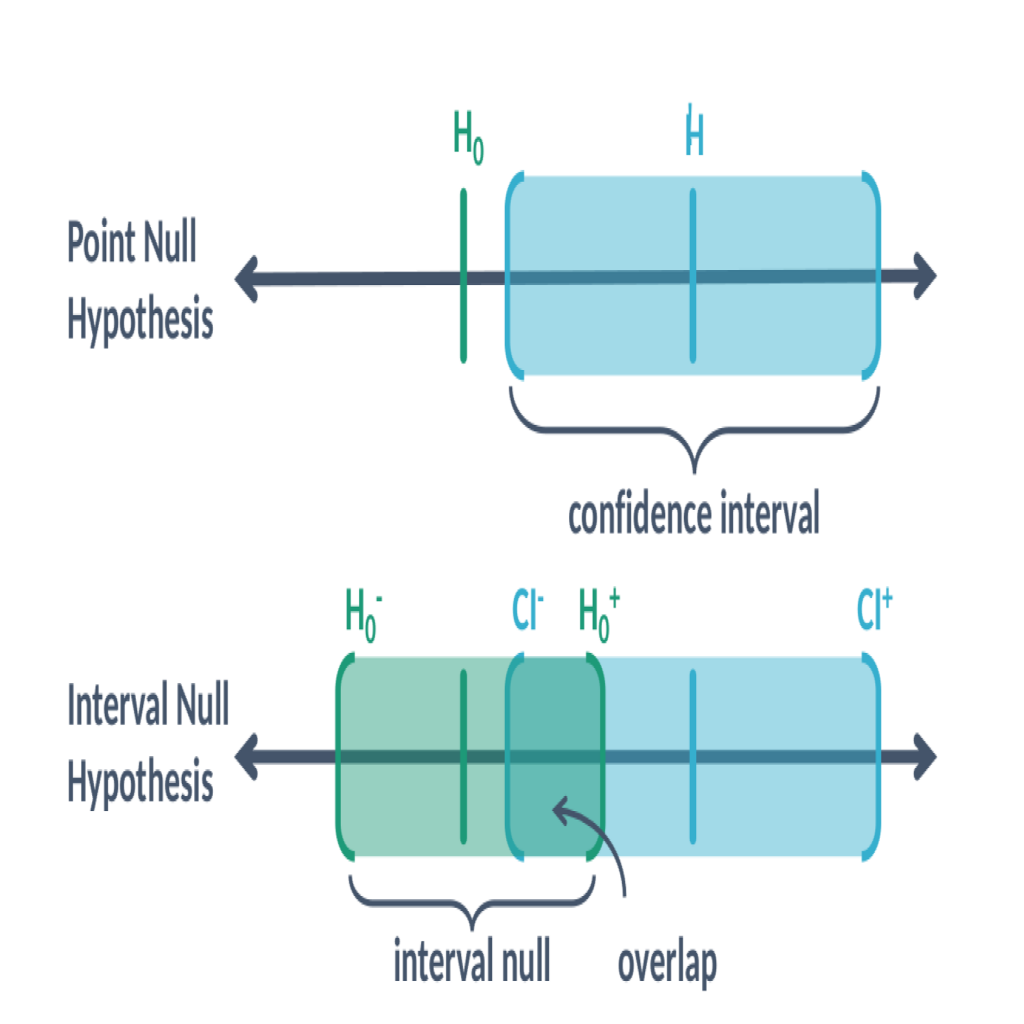
Figure 1. Graphical illustration of a classical point null hypothesis H0 along with the parameter estimate H and the confidence interval [CI−, CI+]; To calculate the second-generation p-value, the interval null hypothesis [H0−, H0+] should be pre-specified. This new p-value is a proportion of the data-consistent interval [CI−, CI+] that overlaps with the null-consistent interval [H0−, H0+].
Is it the next statistics idol?
Verifying that a statistically significant result is scientifically meaningful is not only a sound scientific practice but also a natural way to control the Type-I (false positive) error rate. In addition to its easier and more natural interpretation, the second-generation p-value also enjoys other favorable properties of the classical p-value while emphasizing scientific relevance to expand its utility, functionality, and applicability. Based on the applications in survival analyses and clinical trials, it has been shown to automatically incorporate a proper scientific adjustment for multiple comparisons and reduce false discovery rates when compared to the classical p-value. Moreover, the second-generation p-value has been shown to work well in regularized models, leading to improved model selection procedures for linear and generalized linear models. It is also said to be non-denominational in the sense that it could be readily applied in frequentist, likelihood and Bayesian settings. As a service to science, this could be significant advancement to promote transparency, rigor and reproducibility of scientific results.
Looking forward to the future
It should be noted that the second-generation p-value is not a probability while the first-generation p-value is. It stands just as a descriptive proportion, not even a Bayesian posterior probability. It is a summary statistic to indicate how compatible the observed data are with the null hypothesis specified a priori. It is certainly an interesting metric to think about, especially during this time when everyone is condemning the century-old classical p-value. Nevertheless, the second-generation p-value has its own caveats, and its deep statistical characteristics and properties, in particular its Bayesian connection, are yet to be studied in order to better guide the scientific communities at large. In the meantime, other researchers may come up with the third-generation p-value as we continue this quest for the Holy Grail of statistical science. Until then, our love-hate relationship with the classical p-value will continue.