
Connected chaos: how signals housed in network vertices trigger a fresh brand of permutation entropy
Title: Permutation Entropy for Graph SignalsAuthors & Year: Fabila-Carrasco, J.S., Tan, C. and Escudero, J. (2022)Journal: IEEE Transactions on Signal and Information Processing over Networks [DOI: 10.1109/TSIPN.2022.3167333]Review Prepared by Moinak Bhaduri. Associate Professor, Mathematical Sciences, Bentley University Imagine being a weather scientist, tasked with monitoring temperature fluctuations at recording stations at odd locations strewn across the country, raising alarms when something looks off. You may yawn at the blandness. Temperature, you would say, is something whose fluctuations are, by default, predictable (after all, they are not like stock prices): it generally gets warmer as the sun rises, and cooler as the sun sets. What else is there to observe? It is a nice, almost boring system that never alters. And the fact that this is true regardless of where you are – by the sea or atop a mountain – adds to the blandness. But before you resign and say…
Using Supervised Convex Clustering for Two Dimensional Clusters
Title: Supervised Convex ClusteringAuthors & Year: Minjie Wang, Tianyi Yao, and Genevera I. Allen (2023)Journal: Biometrics [DOI: 10.1111/biom.13860]Review Prepared by Edmond Sanou Clustering is a common way for computers to group together similar things when we don’t already know the categories. The problem is that the groups it finds are sometimes hard to make sense of. In real life, though, we often have extra pieces of information, like doctors’ opinions or other clues, that, while imperfect, can help guide the grouping. The authors Wang, Yao, and Allen. created a new method called supervised convex clustering (SCC), which combines both the raw data and these extra guiding clues. This makes the discovered groups easier to interpret and more meaningful scientifically. They also adapted the method so it can handle different kinds of extra information and even look for patterns in two dimensions at once (biclusters). When they tested SCC, including on…
Beyond the Numbers – Why Causal Inference Needs More Than Statistics
Title: Causal Inference Is Not Just a Statistics ProblemAuthors & Year: McGowan, L.D., Gerke, T., and Barrett, M. (2024)Journal: Journal of Statistics and Data Science Education [DOI: 10.1080/26939169.2023. 2276446]Review Prepared by David Han Causality Is Not Obvious, Even with Good Data In Statistics 101, we learn that correlation does not imply causation. Truly understanding this is one of the trickiest challenges across all disciplines. Let’s start with a question: Does drinking coffee cause better exam performance? You might run a survey and find that students who drink more coffee tend to score higher. Great! Does this mean coffee helps you score better? Not so fast. What if more studious students are both more likely to drink coffee and more likely to study hard? In that case, it is not the coffee. It is their study habits. Or what if students drink coffee because they are stressed from cramming, and that…
More than averages: using causal quartets to illustrate variability
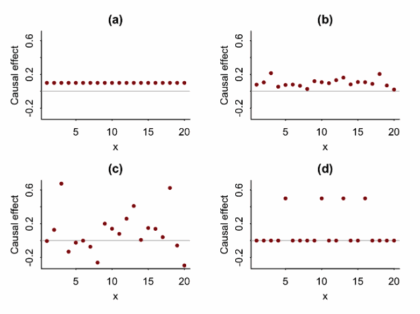
Article Title: Causal Quartets: Different Ways to Attain the Same Average Treatment Effects [DOI:10.1080/00031305.2023.2267597]Authors & Year: A. Gelman, J. Hullman, and L. Kennedy (2023)Journal: The American StatisticianReview Prepared by Peter A. Gao Causal inference research commonly focuses on estimation of average treatment effects: In a target population, what is the difference in mean outcomes between individuals who receive the treatment and individuals who receive a control? For example, imagine an experiment investigating whether limiting daily phone usage improves academic performance among high school students. Subjects are randomly sorted into a treatment group (limited to one hour of phone time daily) or a control group (unrestricted) and over the course of a semester, their academic performance is measured using exams. In this case, the average treatment effect is simply the average exam score of the treated students minus the average score of the control students. If this effect is large and…
The Power of Online Experiments – What Big Tech Can Teach Us About Testing Ideas
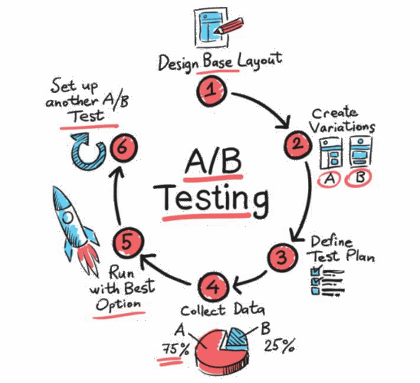
Article Title: Statistical Challenges in Online Controlled Experiments: A Review of A/B Testing Methodology Authors & Year: Larsen, N., Stallrich, J., Sengupta, S., Deng, A., Kohavi, R., Stevens, N.T. (2024) Journal: The American Statistician [DOI: 10.1080/00031305.2023.2257237]Review Prepared by David Han What’s an Online Experiment & Why Should We Care? Have you ever wondered how Netflix decides what thumbnails to parade on your screen, or how Amazon chooses what items to nudge into your recommendations? Behind the scenes, many of these choices come from something known as A/B testing, a type of experiment that companies rely on to make smart, data-driven decisions. Picture this: After creating two versions of a webpage, you deploy each site to separate groups of users online. You then patiently wait to see which one performs better – say, attracting more clicks or garnering more purchases. This is an A/B test in action. In the tech world,…
How can Gaussian graphical Networks Models help in exploring Ovarian cancer data?
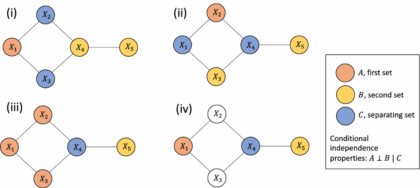
Article: Gaussian graphical models with applications to omics analysesAuthors and Year: Katherine H. Shutta, Roberta De Vito, Denise M. Scholtens, Raji Balasubramanian 2022Journal: Statistics in Medicine Review Prepared by: Sanou Edmond, Postdoc in BiostatisticsNuclear Safety and Radiation Protection Authority (ASNR) As scientists collect more detailed biological data, they use networks to understand how molecules in the body interact and how these interactions relate to disease. This type of data, known as omics, includes information about genes (genomics), proteins (proteomics), and other molecules. These networks can help find genes linked to illness and even suggest possible treatment options. Statisticians help by using tools that highlight which molecules are directly connected. In their tutorial “Gaussian Graphical Models with Applications to Omics Analyses,” Shutta et al. recommend using a method called Gaussian Graphical Models (GGMs) to study these connections. GGMs help draw simple, clear maps of how molecules relate to each other. The authors…
Directional weirdness: when statistical depth runs out of depth
Article: Directional Outlyingness for Multivariate Functional DataAuthors and Year: Wenlin Dai & Marc G. Genton 2019Journal: Computational Statistics & Data Analysis Review Prepared by: Moinak BhaduriDepartment of Mathematical Science, Bentley University, Massachusetts Outliers are individuals and entities to whom we have forever turned with awe and skepticism, with curiosity and suspicion, with expectation and anxiety. They do not fit the norm and are, oftentimes, for better or for worse, risky to ignore. Malcolm Gladwell in his book Outliers: The story of Success samples our society and brings out such remarkable individuals and examines commonalities: what thread binds them, what makes them deviate from the crowd. And just as a common tendency is difficult to pinpoint while investigating these people – some were forced to the extremes by social pressure or hardships, while some others are propelled by sheer curiosity – statistical data which are more complex than simple numbers, may…
Understanding how selection bias impacts our ability to learn from health data
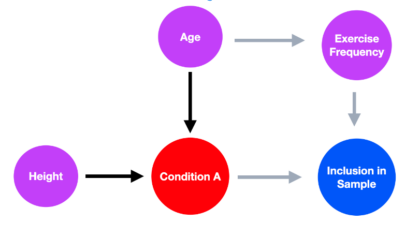
Article Title: A framework for understanding selection bias in real-world healthcare data Authors & Year: R. Kundu, X. Shi, J. Morrison, J. Barrett, and B. Mukherjee (2024)Journal: Journal of the Royal Statistical Society Series A: Statistics in SocietyReview Prepared by Peter A. Gao Electronic health record (EHR) databases compile hundreds of thousands, or even millions, of patients’ medical histories, enabling researchers to study large populations and observe how their health evolves over time. The databases present an opportunity to identify risk factors for certain diseases, evaluate the efficacy of treatments for people of different backgrounds, and map health disparities. However, individuals are rarely included in such datasets at random, meaning the observed sample may not be representative of the target population. If certain groups are underrepresented in EHR data, using it to measure the prevalence of a condition or to assess the association between a risk factor and a condition…
Generative A.I. in SPC: Unlocking New Potential while Tackling the Risks
Title: How generative AI models such as ChatGPT can be (mis)used in SPC practice, education, and research? An exploratory studyAuthors & Year: Megahed, F.M., Chen, Y.J., Ferris, J.A., Knoth, S., and Jones-Farmer, L.A. (2023)Journal: Quality Engineering [DOI:10.1080/08982112.2023.2206479]Review Prepared by David Han Statistical Process Control (SPC) is a well-established statistical method used to monitor and control processes, ensuring they operate at optimal levels. With a long history of application in manufacturing and other industries, SPC helps detect variability and maintain consistent quality. Tools like control charts play a central role in identifying process shifts or trends, allowing timely interventions to prevent serious defects. Megahed, et al. (2023) explores how generative AI, particularly ChatGPT, can enhance the efficiency of SPC tasks by automating code generation, documentation, and educational support. While AI shows promise for routine tasks, the study also highlights its limitations in handling more complex challenges. For instance, ChatGPT’s misunderstanding of…
A promising way to disentangle time from space kicks off
Review Prepared by: Moinak Bhaduri Mathematical Sciences, Bentley University, Massachusetts Fine! I admit it! The title’s a bit click-baity. “Time” here need not be some immense galactic time. “Space” refers here not to the endless physical or literal space around you, but more to the types of certain events. But once you realize why the untangling was vital, how it is achieved in games such as soccer, and what forecasting benefits it can lead to, you’ll forgive me. You see, for far too long, whenever scientists had to model (meaning describe and potentially, forecast) phenomena that had both a time and a value component, such as the timing of earthquakes and magnitude of those shocks, or times of gang violence and casualties because of those attacks, their default go-to were typical spatio-temporal processes such as the marked Hawkes (described below). While with that reliance no fault may be found in…