Article Title: Statistical Challenges in Online Controlled Experiments: A Review of A/B Testing Methodology
Authors & Year: Larsen, N., Stallrich, J., Sengupta, S., Deng, A., Kohavi, R., Stevens, N.T. (2024)
Journal: The American Statistician [DOI: 10.1080/00031305.2023.2257237]
Review Prepared by David Han
What’s an Online Experiment & Why Should We Care?
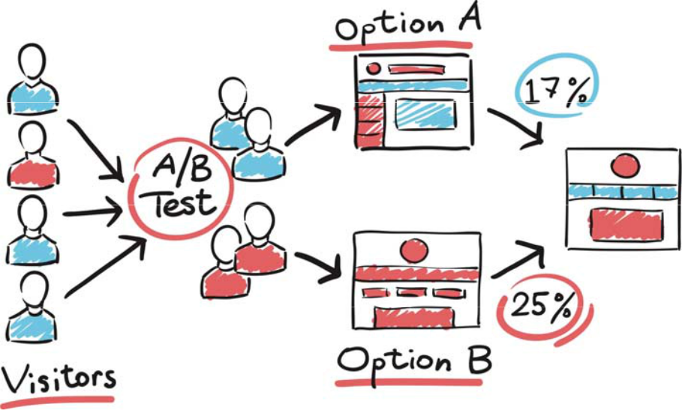
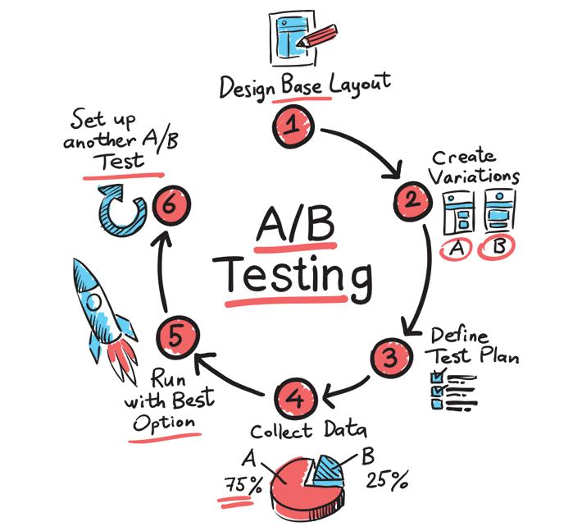
Have you ever wondered how Netflix decides what thumbnails to parade on your screen, or how Amazon chooses what items to nudge into your recommendations? Behind the scenes, many of these choices come from something known as A/B testing, a type of experiment that companies rely on to make smart, data-driven decisions. Picture this: After creating two versions of a webpage, you deploy each site to separate groups of users online. You then patiently wait to see which one performs better – say, attracting more clicks or garnering more purchases. This is an A/B test in action. In the tech world, this feature is part of a broader suite of tools called Online Controlled Experiments (OCEs). Recent work done by Larsen et al. reviews how big-name companies like Amazon, Netflix, and even Duolingo use these tests to improve user experience, increase revenue, and remain ahead of their competitors. Google, for instance, once tested 41 shades of blue for the color of their search results. The reaction? An estimated $200 million increase in annual revenue! Selectively implemented, even small tweaks can significantly sway performance. So, why should this matter to us? As digital services grow, understanding how they evolve can help you think critically about what you see online and maybe one day build smarter web-based products yourself.
Behind the Curtain – Challenges of A/B Testing at Scale
Running A/B tests may sound like a simple task, but doing them well, especially over millions of users, is anything but. Larsen and colleagues outline several tricky obstacles faced by scientists and engineers on this front.
1. Tiny Effects, Big Stakes
Imagine you want to test a change that improves revenue by just 0.02%. That difference may sound small, but for a company like Amazon, it could mean millions of dollars. Detection of such a marginal effect would require a huge number of users for the experimental design, sometimes quite literally exceeding the population of Earth! To deal with this, companies employ techniques like
- Cleaning and transforming data to reduce noise.
- Using historical user data to improve accuracy, also termed the CUPED method.
- Triggering, or only including data from users who interact with the change (e.g., visit a checkout page) to avoid diluting results with unaffected participants.
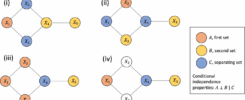
Sometimes, a change pays off in one group but fails in another. For example, a new feature might boost engagement on mobile but not on desktop. That is deemed a heterogeneous treatment effect. Tech companies frequently have methods to detect these group-specific differences, often with assistance from machine learning, helping them personalize user experiences.
3. Short-Term vs. Long-Term ImpactA new feature might show good results on its inception but lead to user fatigue over time. Companies want to measure these long-term effects but face barriers as users switch devices, clear cookies, or leave their platforms entirely. Instead of running lengthy, potentially unreliable experiments, they look for early indicators that are predictive of future outcomes. Rather than tracking revenue for months, they might monitor click behavior for a few days as a stand-in, or surrogate, for long-term success.
4. Stopping at the Right TimeSuppose that midway through testing two versions of an app, one is clearly falling behind with its frequent crashes. Should you cut your investigation short? Although it may seem like the logical choice, doing so can accidentally increase the chance of false discovery events, like finding evidence of success where it isn’t yet clear. To fix this so-called peeking problem, researchers have developed specialized math tools like sequential testing and “always-valid p-values” that allow tests to stop early without messing up the statistics. Many have now found their way into public platforms like Optimizely.
5. People Aren’t Islands – They Influence Each OtherWhile testing a new messaging feature on Facebook, a user who got the update messages a friend who did not, potentially leading them to respond more than usual on the app and creating interference. When one user’s experience affects another’s, the typical A/B test assumptions are broken. To manage this scenario, companies could
- Group connected users when assigning tests.
- Run switchback experiments by releasing new versions to different users at different times, avoiding overlap.
- Adjust how they interpret results to account for these complexities.
Final Remarks – Why This Research Matters
Beyond simply explaining how tech giants use experiments to up their benchmarks, Larsen et al. show how statistical thinking is reshaping decision-making in the digital age. Whether it’s Netflix expanding from just 2 to over 190 countries or Duolingo testing every conceivable variable to improve language learning, A/B testing powers the products we use every day. For students, this field is a goldmine of opportunity. And here’s the kicker: You don’t have to be a mathematical genius. All you need is some creativity, a willingness to think critically, and a bit of curiosity. In an era where every click counts, understanding the “why” behind our online choices can set you apart, whether you are building the next hit app or just wondering why your YouTube homepage keeps changing.