
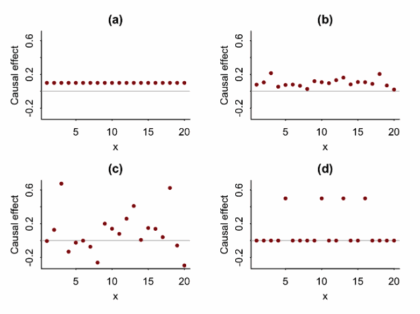
More than averages: using causal quartets to illustrate variability
Article Title: Causal Quartets: Different Ways to Attain the Same Average Treatment Effects [DOI:10.1080/00031305.2023.2267597]Authors & Year: A. Gelman, J. Hullman, and L. Kennedy (2023)Journal: The American StatisticianReview Prepared by Peter A. Gao Causal inference research commonly focuses on estimation of average treatment effects: In a target population, what is the difference in mean outcomes between individuals who receive the treatment and individuals who receive a control? For example, imagine an experiment investigating whether limiting daily phone usage improves academic performance among high school students. Subjects are randomly sorted into a treatment group (limited to one hour of phone time daily) or a control group (unrestricted) and over the course of a semester, their academic performance is measured using exams. In this case, the average treatment effect is simply the average exam score of the treated students minus the average score of the control students. If this effect is large and…
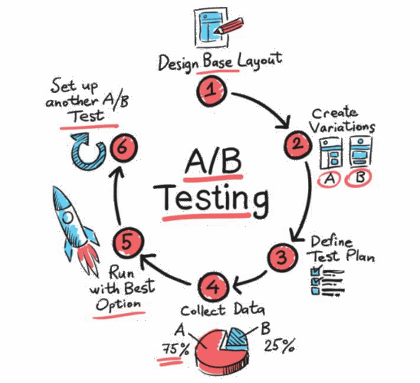
The Power of Online Experiments – What Big Tech Can Teach Us About Testing Ideas
Article Title: Statistical Challenges in Online Controlled Experiments: A Review of A/B Testing Methodology Authors & Year: Larsen, N., Stallrich, J., Sengupta, S., Deng, A., Kohavi, R., Stevens, N.T. (2024) Journal: The American Statistician [DOI: 10.1080/00031305.2023.2257237]Review Prepared by David Han What’s an Online Experiment & Why Should We Care? Have you ever wondered how Netflix decides what thumbnails to parade on your screen, or how Amazon chooses what items to nudge into your recommendations? Behind the scenes, many of these choices come from something known as A/B testing, a type of experiment that companies rely on to make smart, data-driven decisions. Picture this: After creating two versions of a webpage, you deploy each site to separate groups of users online. You then patiently wait to see which one performs better – say, attracting more clicks or garnering more purchases. This is an A/B test in action. In the tech world,…
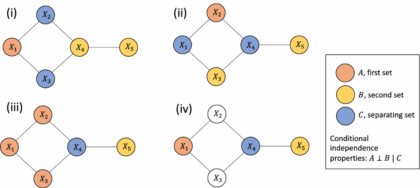
How can Gaussian graphical Networks Models help in exploring Ovarian cancer data?
Article: Gaussian graphical models with applications to omics analysesAuthors and Year: Katherine H. Shutta, Roberta De Vito, Denise M. Scholtens, Raji Balasubramanian 2022Journal: Statistics in Medicine Review Prepared by: Sanou Edmond, Postdoc in BiostatisticsNuclear Safety and Radiation Protection Authority (ASNR) As scientists collect more detailed biological data, they use networks to understand how molecules in the body interact and how these interactions relate to disease. This type of data, known as omics, includes information about genes (genomics), proteins (proteomics), and other molecules. These networks can help find genes linked to illness and even suggest possible treatment options. Statisticians help by using tools that highlight which molecules are directly connected. In their tutorial “Gaussian Graphical Models with Applications to Omics Analyses,” Shutta et al. recommend using a method called Gaussian Graphical Models (GGMs) to study these connections. GGMs help draw simple, clear maps of how molecules relate to each other. The authors…
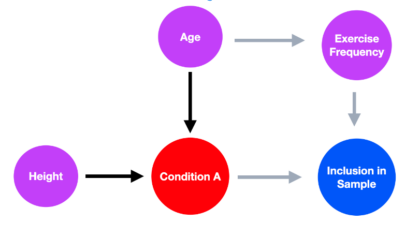
Understanding how selection bias impacts our ability to learn from health data
Article Title: A framework for understanding selection bias in real-world healthcare data Authors & Year: R. Kundu, X. Shi, J. Morrison, J. Barrett, and B. Mukherjee (2024)Journal: Journal of the Royal Statistical Society Series A: Statistics in SocietyReview Prepared by Peter A. Gao Electronic health record (EHR) databases compile hundreds of thousands, or even millions, of patients’ medical histories, enabling researchers to study large populations and observe how their health evolves over time. The databases present an opportunity to identify risk factors for certain diseases, evaluate the efficacy of treatments for people of different backgrounds, and map health disparities. However, individuals are rarely included in such datasets at random, meaning the observed sample may not be representative of the target population. If certain groups are underrepresented in EHR data, using it to measure the prevalence of a condition or to assess the association between a risk factor and a condition…
Generative A.I. in SPC: Unlocking New Potential while Tackling the Risks
Title: How generative AI models such as ChatGPT can be (mis)used in SPC practice, education, and research? An exploratory studyAuthors & Year: Megahed, F.M., Chen, Y.J., Ferris, J.A., Knoth, S., and Jones-Farmer, L.A. (2023)Journal: Quality Engineering [DOI:10.1080/08982112.2023.2206479]Review Prepared by David Han Statistical Process Control (SPC) is a well-established statistical method used to monitor and control processes, ensuring they operate at optimal levels. With a long history of application in manufacturing and other industries, SPC helps detect variability and maintain consistent quality. Tools like control charts play a central role in identifying process shifts or trends, allowing timely interventions to prevent serious defects. Megahed, et al. (2023) explores how generative AI, particularly ChatGPT, can enhance the efficiency of SPC tasks by automating code generation, documentation, and educational support. While AI shows promise for routine tasks, the study also highlights its limitations in handling more complex challenges. For instance, ChatGPT’s misunderstanding of…
A promising way to disentangle time from space kicks off
Review Prepared by: Moinak Bhaduri Mathematical Sciences, Bentley University, Massachusetts Fine! I admit it! The title’s a bit click-baity. “Time” here need not be some immense galactic time. “Space” refers here not to the endless physical or literal space around you, but more to the types of certain events. But once you realize why the untangling was vital, how it is achieved in games such as soccer, and what forecasting benefits it can lead to, you’ll forgive me. You see, for far too long, whenever scientists had to model (meaning describe and potentially, forecast) phenomena that had both a time and a value component, such as the timing of earthquakes and magnitude of those shocks, or times of gang violence and casualties because of those attacks, their default go-to were typical spatio-temporal processes such as the marked Hawkes (described below). While with that reliance no fault may be found in…
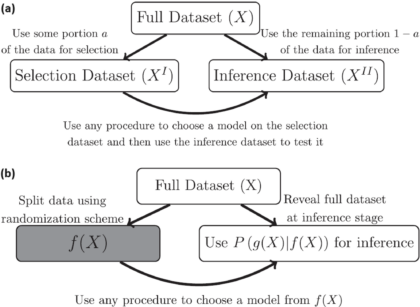
Data Fission – Statistical Analysis through Data Point Separation
Title: Data Fission: Splitting a Single Data PointAuthors & Year: J. Leiner, B. Duan, L. Wasserman, and A. Ramdas (2023)Journal: Journal of the American Statistical Association[DOI:10.1080/01621459.2023.2270748]Review Prepared by David Han Why Split the Data? In statistical analysis, a common practice is to split a dataset into two (or more) parts, typically one for model development and the other for model evaluation/validation. However, a new method called data fission offers a more efficient approach. Imagine you have a single data point, and you want to divide it into two pieces that cannot be understood separately but can fully reveal the original data when combined. By adding and subtracting some random noise to create these two parts, each part contains unique information, and together they provide a complete picture. This technique is useful for making inferences after selecting a statistical model, allowing for better flexibility and accuracy compared to traditional data splitting…
“Changes” in statistics, “changes” in computer science, changes in outlook
No matter how free interactions become, tribalism remains a basic trait. The impulse to form groups based on similarities of habits – of ways of thinking, the tendency to congregate across disciplinary divides, never goes away fully regardless of how progressive our outlook gets. While that tendency to form cults is not problematic in itself (there is even something called community detection in network science that exploits – and exploits to great effects – this tendency) when it morphs into animosity, into tensions, things get especially tragic. The issue that needs to be solved gets bypassed, instead noise around these silly fights come to the fore. For example, the main task at hand could be designing a drug that is effective against a disease, but the trouble may lie in the choice of the benchmark against which this fresh drug must be pitted. In popular media, that benchmark may be the placebo – an inconsequential sugar pill, while in more objective science it could be the drug that is currently in use. There are instances everywhere of how scientists and journalists come in each other’s way (Ben Goldacre’s book Bad Science imparts crucial insights) or how even among scientists, factionalism persists: how statisticians – even to this day – prefer to be classed as frequentists or Bayesians, or how even among Bayesians, whether someone is an empirical Bayesian or not. The sad chain never stops. You may have thought of this tendency and its result. How it is promise betrayed, collaboration throttled in the moment of blossoming. While the core cause behind that scant tolerance, behind that clinging on to, may be a deep passion for what one does, the problem at hand pays little regard to that dedication. The problem’s outlook stays ultimately pragmatic: it just needs solving. By whatever tools. From whatever fields. Alarmingly, the segregations or subdivisions we sampled above and the differences they lead to – convenient though they may be – do not always remain academic: distant to the point of staying irrelevant. At times, they deliver chills much closer to the bone: whether a pure or applied mathematician will get hired or promoted, how getting published in computer science journals should be – according to many – more frequent compared to those in mainstream statistics, etc.
Decoding Digital Preferences: A Collaborative Approach to Solving the Mysteries of A/B Testing
As a digital detective, your mission is to decipher the preferences of your website visitors. Your primary tool? A/B testing – a method used in online controlled experiments where two versions of a webpage (version A and version B) are presented to different subsets of users under the same conditions. It’s akin to a magnifying glass, enabling you to scrutinize the minute details of user interactions across two versions of a webpage to discern their preferences. However, this case isn’t as straightforward as it seems. A recent article by Nicholas Larsen et al. in The American Statistician reveals the hidden challenges of A/B testing that can affect the results of online experiments. If these challenges aren’t tackled correctly, they can lead to misleading conclusions, affecting decisions in both online businesses and academic research.
Differential Privacy Unveiled – the Case of the 2020 Census for Redistricting and Data Privacy
Census statistics play a pivotal role in making public policy decisions such as redrawing legislative districts and allocating federal funds as well as supporting social science research. However, given the risk of revealing individual information, many statistical agencies are considering disclosure control methods based on differential privacy, by adding noise to tabulated data and subsequently conducting postprocessing. The U.S. Census Bureau in particular has implemented a Disclosure Avoidance System (DAS) based on differential privacy technology to protect individual Census responses. This system adds random noise, guided by a privacy loss budget (denoted by ϵ), to Census tabulations, aiming to prevent the disclosure of personal information as mandated by law. The privacy loss budget value ϵ determines the level of privacy protection, with higher ϵ values allowing more noise. While the adoption of differential privacy has been controversial, this approach is crucial for maintaining data confidentiality. Other countries and organizations are also considering this technology as well.