
Title: On the role of data, statistics and decisions in a pandemic
Author(s) and Year: Jahn, B., Friedrich, S. et al., 2022.
Journal: AStA Advances in Statistical Analysis (Open Access)
In responding to a pandemic, time is of the essence. As the COVID-19 pandemic has raged on, it has become evident that complex decisions must be made as quickly as possible, and quality data and statistics are necessary to drive the solutions that can prevent mass illness and death. Therefore, it is essential to outline a robust and generalizable statistical process that cannot only help to diminish the current COVID-19 pandemic but also assist in the prevention of potential future pandemics.
A recent paper by Jahn and Friedrich et al. addresses the following questions to develop such a strategy: How can effective, life-saving decisions be made despite the chaos and uncertainty of a pandemic? Furthermore, how can these findings be quickly adjusted based on the discovery of new information to pivot public health strategies and prevent adverse outcomes? The authors answer these questions from mathematical and statistical perspectives by discussing an approach for more practical, data-driven decision-making that progresses from data collection to modeling methods, health-preserving decisions, and, ultimately, impactful communication strategies that can put life-saving decisions into action.
From Data to Decisions
Mathematical and statistical modeling workflows for decision-making typically start with acquiring data and end with making decisions based on the findings from this data. However, mathematical and statistical approaches do not always follow the same steps between their inceptions and conclusions.
In statistics, a typical workflow starts with a research question, proceeds with data gathering, and continues with fine-tuning appropriate statistical models for this data before making final decisions (see Figure 1). In comparison, mathematical modeling workflows typically make educated assumptions after initiating an inquiry and construct a system or model based on these premises that yields information and leads to a set of decisions. Note that this reordering of steps includes a reversal of the two intermediate stages of a standard statistical workflow.

Figure 1. Comparison of statistical and mathematical modeling workflows in how they move from an initial question to a set of decisions. Reproduced without modification from Figure 1 of Jahn, B., Friedrich, S. et al., 2022.
Regardless of the workflow chosen for an analysis, one important point to remember is that many of these steps may have to be repeated cyclically as a pandemic progresses. For example, suppose novel cases are detected in a region previously unaffected by a pandemic. In this case, the models trained on the older data will need to be updated with this newer information to produce more useful results. Also, the decisions that need to be made to preserve the public health of the region will probably need to be revisited and revised.
Decision-Analytic Modeling
According to Jahn and Friedrich et al., modeling in the context of a pandemic can serve three purposes: evaluation, prediction, and decision-making. Models used for decision-making can also be referred to as decision-analytic models.
Several techniques can be used for decision-analytic modeling, including decision tree models and state-transition cohort Markov models (STMs). Decision tree models are statistical models that can describe the outcomes of complex combinations of public health interventions based on all data collected. Alternatively, STMs are mathematical models that can estimate and validate assumptions used in predicting health states (e.g., susceptible, exposed, infected, recovered, and deceased) and the transitions between these states. Deciding which type of model to use depends on many factors, including the length of time and the properties of the disease that are to be modeled. For example, decision tree models are often applied to problems that can be solved by intricate branching logic, whereas STMs are more appropriate for sequential, time-dependent problems.
In addition to these two individual types of models, hybrid models, including combinations of decision tree models and STMs, can be used to solve decision problems in a pandemic (see Figure 2). Sheinson et al. formulated a hybrid model composed of a short-term acute care decision tree and a post-hospital discharge STM to estimate the quantifiable impacts of potential COVID-19 treatments and help determine if the societal costs of these treatments are proportionate to their efficacy.
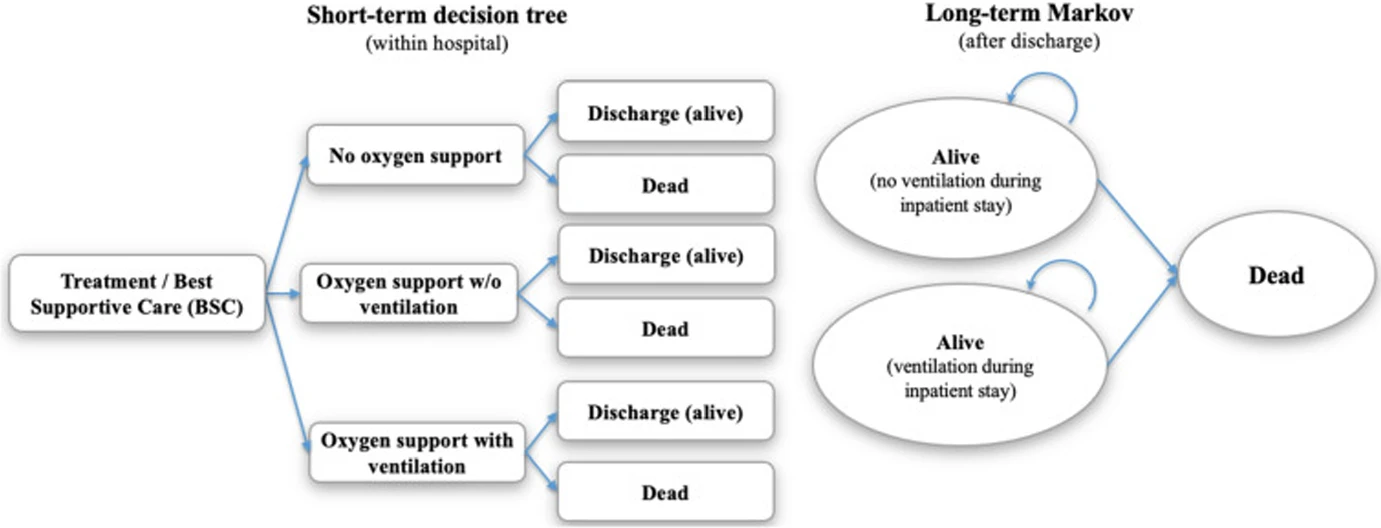
Figure 2. A hybrid model of COVID-19 treatment cost effectiveness that is composed of a decision tree model and an STM. Reproduced without modification from Figure 2 of Jahn, B., Friedrich, S. et al., 2022. Originally published as Figure 1 in Sheinson et al., 2021.
Recommendations and Potential Impacts
Once a model is developed and its set of decisions is finalized, how can these results be communicated effectively enough to kickstart needed changes? Jahn and Friedrich et al. postulated that in order for findings to be practical and adopted in policy decisions, they must be communicated clearly and transparently to non-specialists, including policymakers and the general public. The crises caused by the COVID-19 pandemic have demonstrated that almost every social and political action is based on data and at least one type of mathematical or statistical model. Thus, there is a need to promote mathematical, statistical, and data literacy in all facets of society to enable the public to interpret data and understand model construction and outcomes.
A particularly influential example that the authors cited in this paper was the work of Kretzschmar et al., which utilized a stochastic mathematical model to study the effects of testing delays on COVID-19 contact tracing strategies. Their work started by gathering distributions of the probability of symptom onset and the count of infected contacts per day from published data. The team then constructed a model that considered several factors, including the tracings of close and casual contacts and the time delays between an initial infection, an onset of symptoms, a diagnosis by testing, and an isolation period. The results of this model led to conclusions that expanding access to testing and using mobile app technology to lessen delays can optimize contact tracing coverage and the speed of the collection of information regarding the spread of COVID-19. The model in this paper was also built to be robust to unexpected circumstances through its testing in multiple scenarios where the isolation statuses of the infected and the quarantine statuses of the contacts traced to them varied significantly. Due to this system of tests, decisions made based on this model can be quickly revisited and revised. Additionally, this entire analytical process was published open access with open source code for optimal transparency. All of these steps, both in succession and cyclically, empowered Kretzschmar et al.’s work to not only save lives during the COVID-19 pandemic but also to be documented in an accessible way so that future pandemics similar to COVID-19 may be efficiently mitigated.
Jahn and Friedrich et al.’s paper details every stage of a statistical process that could avert future pandemics, from the evaluation of data to the dissemination of conclusive analytical results. The outcomes of this strategy could result in the most informed decisions that can be made with statistical reasoning along with a mass prevention of disease and mortality. It is critical that the ideas from this work reach readers beyond solely the academic mathematical and statistical communities to not only provide a greater level of quantitative literacy and insight, but to also aid in preventing another global pandemic.
Edited by Alyssa Columbus
Cover image credit: Gerd Altmann
Figures used under CC BY 4.0