Title: Data Fission: Splitting a Single Data Point
Authors & Year: J. Leiner, B. Duan, L. Wasserman, and A. Ramdas (2023)
Journal: Journal of the American Statistical Association
[DOI:10.1080/01621459.2023.2270748]
Review Prepared by David Han
Why Split the Data?
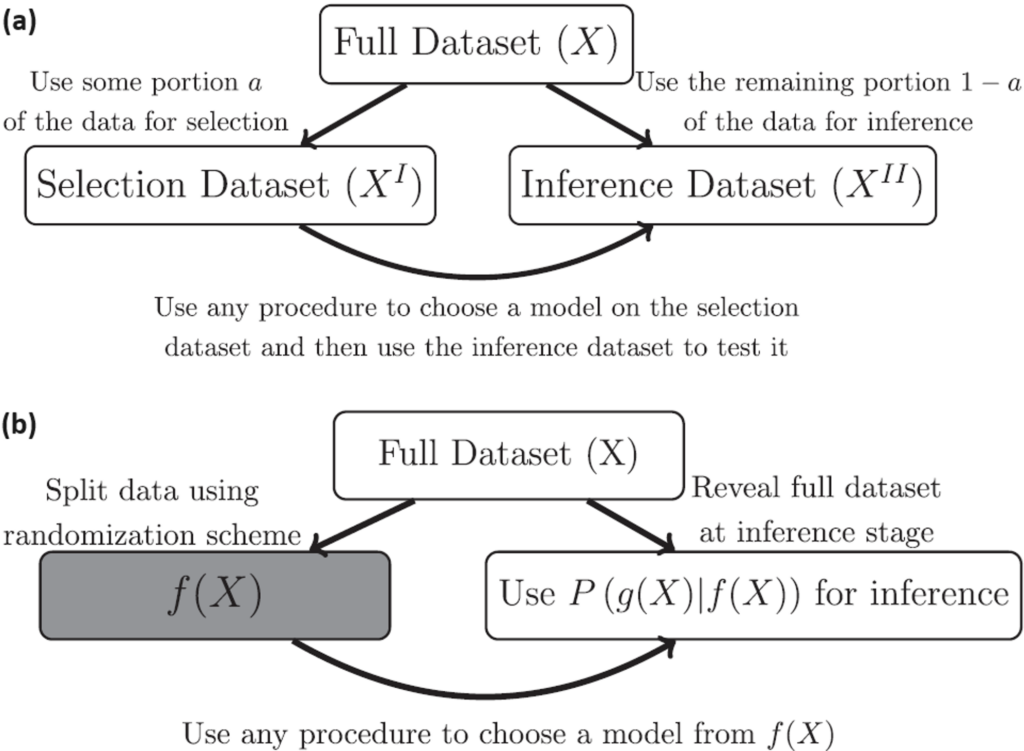
In statistical analysis, a common practice is to split a dataset into two (or more) parts, typically one for model development and the other for model evaluation/validation. However, a new method called data fission offers a more efficient approach. Imagine you have a single data point, and you want to divide it into two pieces that cannot be understood separately but can fully reveal the original data when combined. By adding and subtracting some random noise to create these two parts, each part contains unique information, and together they provide a complete picture. This technique is useful for making inferences after selecting a statistical model, allowing for better flexibility and accuracy compared to traditional data splitting methods; see Figure 1 for illustration. Data fission is beneficial in scenarios where data points are sparse or influential (e.g., extreme values, outliers, or leverage points), and it can be applied to various data types and analyses. The method has broad applications in creating confidence intervals and improving the accuracy of models.
Procedure of Data Fission
So, how do we fission a dataset into two parts? There are two main properties we aim for: either the two parts are completely independent with known behaviors, or one part has a known statistical distribution and the other has a known relationship with the first part. For example, imagine you have a lot of data points, and you are trying to figure out which ones show something interesting without making too many mistakes. Usually, you split the data in a way that keeps the error rate low. Here is how the data fission works.
- Add/subtract random noise to your data points to create two new sets of data.
- Use one set to pick out the interesting data points or features.
- Use the other set to confirm your findings and create confidence intervals to show how sure you are about the results.
This method ensures that even after you select the interesting data points, your confidence intervals remain accurate, which is not always possible with traditional methods. Plus, it works well even if some data points are much more influential than others. This new way of handling data can be helpful for making sure your findings are both interesting and reliable.

Figure 1. (a) Conventional data splitting procedure and post-selection inference; this method enables the use of any selection strategy for model selection but results in reduced power during the inference phase.
(b) Data fission procedure and post-fission inference; similar to data splitting, this method permits any selection procedure for model choice but it is accomplished through randomization instead of directly dividing the data.
Applications of Data Fission: OLS & GLM
For ordinary linear regression (OLS) and generalized linear models (GLM), where we predict outcomes Y based on known features X, data fission can be used to improve accuracy in selecting significant variables/features and estimating their effects. Here is how it works.
- Add controlled noise to the data, creating two sets of data, f(Y) and g(Y).
- Use one set f(Y) to select the best model for figuring out patterns (like finding trends).
- Use the other set g(Y) to estimate the effects of chosen features, and check if those patterns are true. Also, calculate the confidence intervals based on these split datasets to precisely measure the impact of each selected feature.
The method makes sure that both parts capture essential information, particularly useful when some features can strongly influence outcomes; see Figure 2. This way, it ensures that our conclusions are solid and not just lucky guesses. This approach allows for more accurate predictions and better understanding of how different features affect outcomes, especially in datasets with complex relationships between variables. For example, if we are studying how certain factors affect outcomes, data fission helps us accurately select which factors matter most and then correctly estimate their impact. In real-world applications, like analyzing data from experiments or surveys, data fission demonstrated that it can provide more reliable results compared to older methods.

Figure 2. Comparison of (a) conventional data splitting and (b) data fission procedures for a dataset with one highly influential point (e.g., an extreme outlier or a leverage point). In (a), splitting the data and fitting a regression leads to significantly different fitted models because a single data point heavily influences the fitted values. In contrast, data fission in (b) maintains the same location for every data point but randomly perturbs the response Y with random noise to create new variables f(Y) and g(Y). Notice the slight difference in the two figures of (b). This approach allows the analyst to retain a piece of every data point in both f(Y) and g(Y), ensuring that leverage points affect both copies of the dataset.
Application of Data Fission: Nonparametric Regression
In nonparametric regression, where we aim to estimate smooth trends from data, data fission provides a robust method for constructing confidence intervals. First, the data with added noise is split into two parts. The first part helps in selecting a basis for representing the trends in the data, while the second part, conditioned on the first part, is used to calculate confidence intervals. These intervals ensure that the estimated trends are reliable and capture the uncertainty due to noise in the observations. Figure 3 shows that confidence intervals constructed using data fission are tighter and more powerful during the selection process compared to traditional methods like data splitting. Simulation studies and real-world applications, such as analyzing spectroscopy data from astronomy, demonstrate that data fission not only provides accurate estimates but also controls errors (e.g., FCR) effectively, making it a valuable tool in scientific research for studying complex trends and patterns in data.

Figure 3. False coverage rate (FCR; smaller the better), length of the confidence intervals (CI; shorter the better), power of tests (greater the better) and precision (higher the better) for the selected features from Poisson count data over 500 trials; the leverage parameter controls the influence (or leverage) that individual data points have on the overall model fitting process. Larger values indicate more disproportionate influence on the estimated coefficients of the regression model.
Future Directions
Data fission is a novel approach for making informed decisions in various statistical applications. Unlike traditional methods that often divide data in simpler ways, data fission offers a more efficient way to split and analyze information, enhancing our ability to estimate effects and uncertainties accurately. It has shown success in tasks like estimating effects after conducting multiple tests, predicting outcomes in linear and generalized models, and identifying trends in data patterns. For instance, in linear regression and similar models, data fission demonstrated tighter confidence intervals and increased accuracy, especially when dealing with influential data points and smaller datasets. Looking forward, there are opportunities to explore further improvements and applications, such as handling unknown variances and adapting to complex, high-dimensional data scenarios. While challenges remain in aggregating results from multiple data fission processes, the potential benefits for tackling modern issues like data privacy and synthetic dataset creation are promising areas for future research.
