
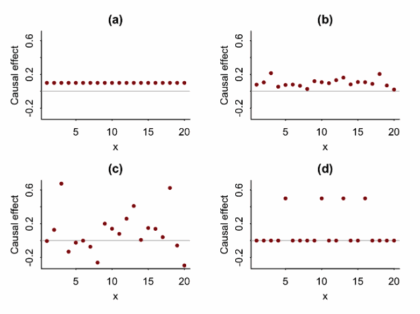
More than averages: using causal quartets to illustrate variability
Article Title: Causal Quartets: Different Ways to Attain the Same Average Treatment Effects [DOI:10.1080/00031305.2023.2267597]Authors & Year: A. Gelman, J. Hullman, and L. Kennedy (2023)Journal: The American StatisticianReview Prepared by Peter A. Gao Causal inference research commonly focuses on estimation of average treatment effects: In a target population, what is the difference in mean outcomes between individuals who receive the treatment and individuals who receive a control? For example, imagine an experiment investigating whether limiting daily phone usage improves academic performance among high school students. Subjects are randomly sorted into a treatment group (limited to one hour of phone time daily) or a control group (unrestricted) and over the course of a semester, their academic performance is measured using exams. In this case, the average treatment effect is simply the average exam score of the treated students minus the average score of the control students. If this effect is large and…
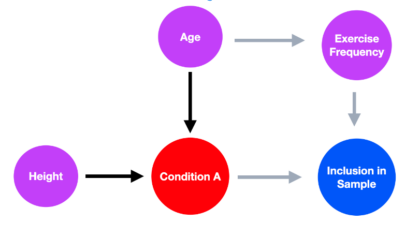
Understanding how selection bias impacts our ability to learn from health data
Article Title: A framework for understanding selection bias in real-world healthcare data Authors & Year: R. Kundu, X. Shi, J. Morrison, J. Barrett, and B. Mukherjee (2024)Journal: Journal of the Royal Statistical Society Series A: Statistics in SocietyReview Prepared by Peter A. Gao Electronic health record (EHR) databases compile hundreds of thousands, or even millions, of patients’ medical histories, enabling researchers to study large populations and observe how their health evolves over time. The databases present an opportunity to identify risk factors for certain diseases, evaluate the efficacy of treatments for people of different backgrounds, and map health disparities. However, individuals are rarely included in such datasets at random, meaning the observed sample may not be representative of the target population. If certain groups are underrepresented in EHR data, using it to measure the prevalence of a condition or to assess the association between a risk factor and a condition…