
Article: Anastasios N. Angelopoulos and Stephen Bates (2023), “Conformal Prediction: A Gentle Introduction”, Foundations and Trends® in Machine Learning: Vol. 16: No. 4, pp 494-591. http://dx.doi.org/10.1561/2200000101
The setting repeats depressingly often. A hurricane inching towards the Florida coast. Weather scientists glued to tracking monitors, hunched over simulation printouts, trying to remove people out of harm’s way. Urgent to them is the need to mark a patch of the shore where the hurricane is likely to hit. Those living in this patch need to be relocated. These scientists, and many before them – it’s hard to say since when – realized what’s at issue here is not quite so much the precise location the storm is going to hit – precise to the exact grain of sand, but rather a stretch of land (whose length may shrink gradually depending on how late we leave the forecasting) where it is going to affect people with a high chance. A forecast interval of sorts. The calculation of this interval may rely on assumptions – some model dependent, some model agnostic – but we like narrow, compact intervals. Something wide, say, stretching from Vermont to Sao Paolo just won’t do: it’s pointless relocating so many people; we need to be precise – a lot less vague.
Different contexts summon different varieties: confidence intervals (in case one targets an average), prediction intervals (in case one targets a specific data point), bootstrap intervals, etc. While ways of stalking the hurricane have bettered, through finer satellite images, for instance, our obsessions with these interval estimates have not shifted. And yet, each refinement marks a deepening, a necessary tweak in response to a fresh peculiarity, despite delivering a similar functionality, despite sharing a common sentiment – that of showing a range of positions over which some random event could have happened.
Classification presents such a fresh peculiarity. Where the same interval-finding or something similar needs to be done, only the predictions we are dealing with are not continuous (like the hurricane could hit anywhere) but discrete labels. In the absence of a good interval-type object, therefore, the kind of panic that throbbed through the shore-dwellers may also grip a doctor tasked with telling whether a patient has cancer by looking at an MRI scan. What is sought for is not quite an interval, but a set serving a similar role – a set such as {cancer, concussion} that is guaranteed to contain the right diagnosis with a high chance. The benefits? Ruling out certain cases. In this instance, ruling out the fact that the patient is “healthy” (which could have been another diagnosis, i.e., another classification label, but one which could not make it to the set), just as in out hurricane analysis, we ruled out the possibility of the hurricane striking somewhere north of Vermont. Angelopoulos and Bates, in their recent work “Conformal Prediction: A Gentle Introduction”, lay out a way to do all this, demanding almost nothing: no distributional assumptions, no reliance on nice models.
The switch from continuous intervals to discrete-valued sets
To be concrete: with the following ingredients:
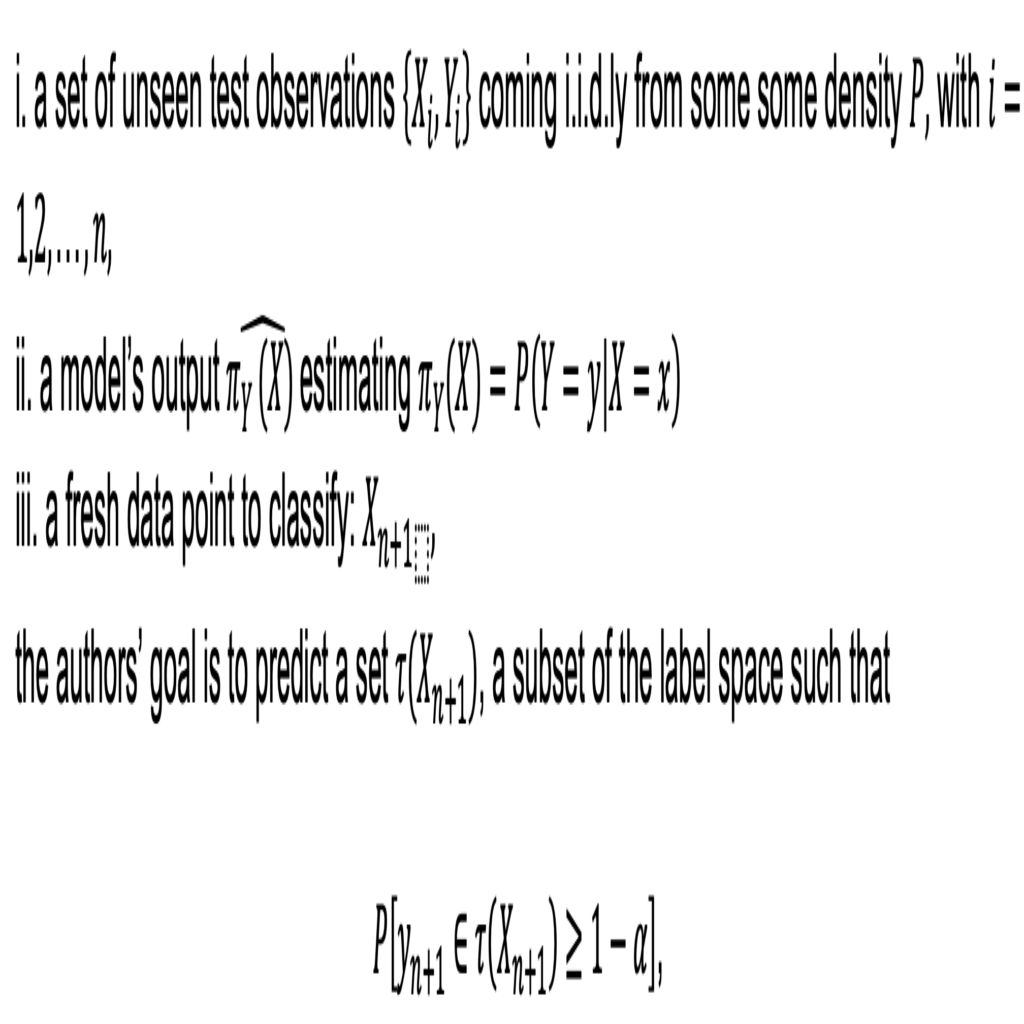
where α is a user-defined error-rate, usually 0.01, 0.05, etc. In general, τ will depend on the observations on step i and the model π on step ii, but no assumptions have been made on the specific nature of π. Any classification model – a neural network, a random forest – will do. In case the inputs are images and the outputs are guesses as to what they represent, Fig 1 below shows how these coverage sets may look. In the second situation, the outline of the giraffe is quite distinct and the underlying classification model, having seen many similar objects in the training phase, is quite sure of it. The τ set, therefore, contains only one label: “giraffe”, much akin to saying our hurricane will hit a tiny city, say Gainesville, in Florida – an extremely pin-pointed answer. In harder scenarios, such as in the last three, the model expresses its unsureness by outputting τ sets containing many labels (some of which are wrong (shown in red), but the model thought to be plausible).

Figure 1: Instances of conformal sets under easy and difficult classification scenarios. These sets guarantee to contain the right label with a high chance. You may have seen confidence intervals. These are similar, only they are not continuous intervals, but discrete lists.
The authors have been careful to insist on these nice properties: that at any level, the size of the τ set must be small (else, one may choose the entire label space with probability 1 – α, without ever having to have the worry of missing the “right” answer) and that the size must be smaller for easier tasks and larger for complicated ones. That’s the overall intention. All that remains now is to know the connection between π and τ. In other words, how would the τ sets be calculated?
Conformal scores: bridges joining π and τ.
Conformal scores serve as the secret sauce. These are defined to be, for the i-th data point
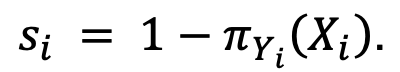
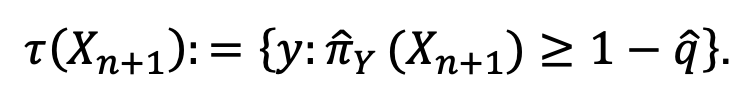
It is big when π for the true class is low, i.e., when the model did a bad job guessing the right label. The next step is to calculate the 1 – α-th quantile, say, 𝑞^ of these conformal scores s1, s2,… sn (to set a standard for the right class to surpass in the future) and, for the test point X n+1, set
With this foundation, the authors move on to highlight complications under which the approach still delivers: what if the image contains many pieces – not just giraffes, but zebras and lions too (so there’s no one right answer), what if the distribution generating the test point changes to something different from the one that generated the training data?
Both within data science and mainstream statistics, conformal predictions are becoming popular by the day. It must be mentioned, though, this forms part of a bigger structure initiated by Volk, Shafer and some others (Volk et al. (2003)). There’s even a dashboard (https://cml.rhul.ac.uk/CP/index.html) where you can tweak α and produce different τ sets with the well-known Iris data, but with a different conformal score.
References:
Angelopoulos, A.N, and Bates, S (2023), “Conformal Prediction: A Gentle Introduction”, Foundations and Trends® in Machine Learning: Vol. 16: No. 4, pp 494-591. http://dx.doi.org/10.1561/2200000101
Vovk,V, Shafer, G., and Nouretdinov, I (2003), “Self-calibrating probability forecasting.,” in Neural Information Processing Systems, pp. 1133–1140.
Interactive dashboard: https://cml.rhul.ac.uk/CP/index.html