
By: Erin McGee
Paper title: Sequential Monte Carlo for Sampling Balanced and Compact Redistricting Plans Authors and year: Cory McCartan, Kosuke Imai, 2023
Journal: Annals of Applied Statistics (Forthcoming 2023),
https://doi.org/10.48550/arXiv.2008.06131
In 2011, the Pennsylvania General Assembly was accused of drawing a redistricting plan for the state that diluted the power of Democratic voters, while strengthening the Republican vote. The case made its way to the Pennsylvania Supreme Court, where it was determined to be an unfairly drawn map.
With more complicated techniques, gerrymandering, or altering districts to purposefully amplify the voting power of some, while reducing others, becomes harder to recognize. Gerrymandered districts are usually identifiable by the ‘jigsaw’ shapes that split counties and municipalities in an attempt to pack certain voting groups into the same district, while splitting others. However, proving that a district map has been purposefully manipulated, as it was in Pennsylvania, is no easy task. Researchers often use different sampling methods and algorithms to both create fair redistricting plans and to compare those to the plans proposed by politicians.
Mathematicians at Harvard recently tackled this problem by testing a new method of creating a sample of districts. A successful sampling method must: be efficient enough to scale to maps with many districts, make sure that the samples represent the target population, and incorporate any legal constraints, which usually means reducing the number of counties, cities, and townships that are divided into different districts, and maintain an approximately equal population in each. While there have been many suggested mathematical models to achieve this, Monte Carlo Simulations have gained a lot of traction, most recently the Sequential Monte Carlo (SMC).
What is a Sequential Monte Carlo and how does it work?
Monte Carlo Simulations are a huge class of mathematical models that have a variety of uses, but are usually characterized by some repeated random sampling. This has been utilized in this case to draw district boundaries given a set of constraints, such as: compactness (or how well contained the districts are), population deviation (which is the difference in population between districts), or boundary splits (which is how much a certain map divides counties or municipalities). Algorithms are weighted to directly satisfy these requirements.
The SMC starts by turning each precinct (which is the smallest voting district) into a node or point on the graph. Each of these points is then randomly connected to create some continuous line, known as a spanning tree. The algorithm then removes one precinct connection, or edge, in the tree, which splits it in two. This edge is removed based on what the algorithm determines is the most promising based on weights that the researchers specified earlier.
Each district is therefore built piece by piece by continuing to build and cut spanning trees, as seen in Figure 1. By repeating this whole process thousands or millions of times, the SMC creates millions of possible maps, all of which are viable, as the samples that fail to meet constraints are discarded. The ‘sequential’ part of the SMC comes from the fact that after each drawing and splitting of the spanning tree, a second algorithm checks that the population of the new district falls within the population bounds.Then, a new set of plans are generated, and the weights are recalculated. This method is better at enforcing the previously set population constraints, as it weighs the constraints everytime it draws a new piece, instead of doing this at the final stage like many methods.
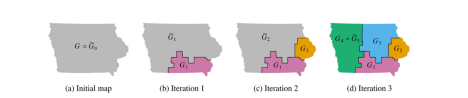
Figure 1: Sequential splitting procedure applied to Iowa, where G0 is the initial district, and more districts are created by continuing to split spanning trees, creating 4 total districts.
The results:
Researchers tested this method using real world data: specifically on the 2011 Pennsylvania redistricting case previously mentioned. They used the method to draw reference maps for the target distribution of the case in question, and weighted the algorithm to follow the specific guidelines outlined by the court. They then created 1,600 sample plans, and compared the distribution of those plans to the ones outlined in the 2011 case. Smaller, more compact districts with fewer edges were considered more democratic in their comparison, as those districts tended to split less counties and municipalities and therefore have a more democratic representation of areas. The result was clear: the plan made by the general assembly was an outlier, having less compactness and more county splits than any of those made by the simulation.
A big question in gerrymandering cases is that of fault: was the district purposely changed to benefit a certain party? This question is usually answered by using real election data to simulate results using the General Assembly’s proposed plan vs. those of the reference maps created by simulations. In the case of 2011, there was strong evidence that the General Assembly gerrymandered in favor of the Republican party, since most of the Democratic vote was in non-competitive districts.
Overall, the SMC method shows a major step towards solving real-world redistricting problems with mathematical models, a major step towards both protecting democracy and voting rights.