Data Fission – Statistical Analysis through Data Point Separation
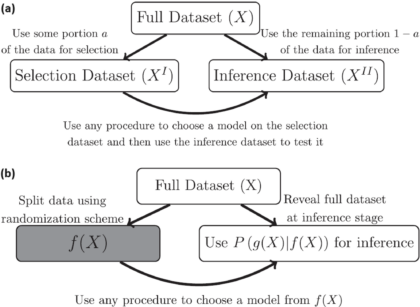
Title: Data Fission: Splitting a Single Data PointAuthors & Year: J. Leiner, B. Duan, L. Wasserman, and A. Ramdas (2023)Journal: Journal of the American Statistical Association[DOI:10.1080/01621459.2023.2270748]Review Prepared by David Han Why Split the Data? In statistical analysis, a common practice is to split a dataset into two (or more) parts, typically one for model development and the other for model evaluation/validation. However, a new method called data fission offers a more efficient approach. Imagine you have a single data point, and you want to divide it into two pieces that cannot be understood separately but can fully reveal the original data when combined. By adding and subtracting some random noise to create these two parts, each part contains unique information, and together they provide a complete picture. This technique is useful for making inferences after selecting a statistical model, allowing for better flexibility and accuracy compared to traditional data splitting…

