Title: Assurance for Sample Size Determination in Reliability Demonstration Testing
Authors & Year: Kevin Wilson & Malcolm Farrow (2021)
Journal: Technometrics [DOI: 10.1080/00401706.2020.1867646]
Why Reliability Demonstration Testing?
Ensuring high reliability is critical for hardware products, especially those involved in safety-critical functions such as railway systems and nuclear power reactors. To build trust, manufacturers use reliability demonstration tests (RDT) where a sample of products is tested and failures are observed. If the test meets specific criteria, it demonstrates the product’s reliability. The RDT design varies based on the type of hardware product being tested, whether it is failure on demand or time to failure. Traditionally, sample sizes for RDT have been determined using methods that consider the power of a hypothesis test or risk criteria. Various approaches, such as Bayesian methods and risk criteria evaluation, have been developed over the decades in order to enhance the effectiveness of RDT. These measures aim to provide consumers with reliable and safe hardware products they can confidently rely on (e.g., your cellphone, laptop/tablet, and automobile). This work by Wilson and Farrow delves into various aspects related to reliability testing, such as accelerated life tests (ALT) and Bayesian acceptance testing (BAT) in quality assurance. It introduces the concept of assurance as a reliable Bayesian method for determining appropriate sample sizes in clinical trials, ensuring the trials lead to successful outcomes. Notably, the use of assurance is not limited to medical settings but extends to non-medical contexts like RDT in quality engineering. The assurance approach separates the design and analysis of the test, allowing for different prior beliefs from the producer and consumer. The work presents new methodologies for incorporating historical data, selecting prior distributions, and analyzing test results.
Assurance as a Bayesian Approach in RDT
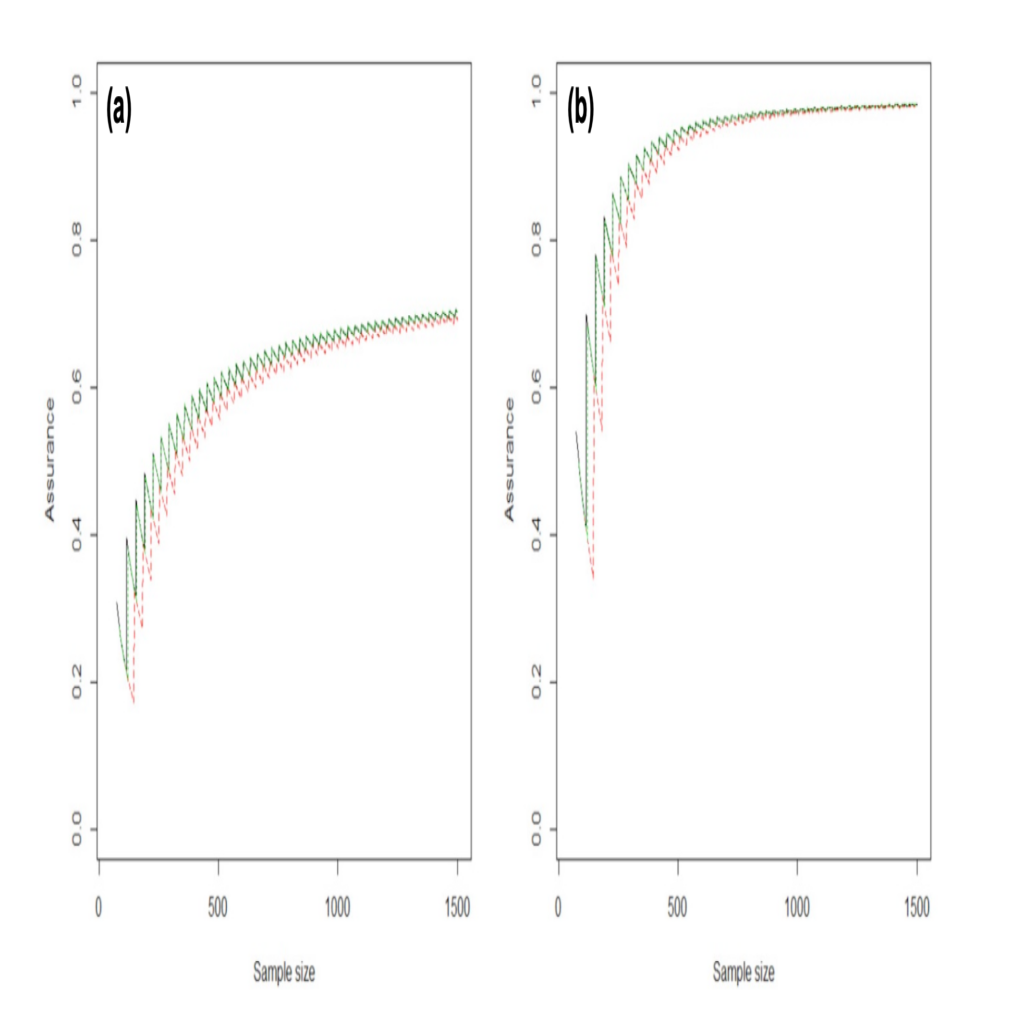
The decision to design the RDT lies with the producer, while the ultimate acceptance or rejection of the product rests with the consumer. Traditionally, the consumer employs a consumer’s-risk approach, selecting a criterion to meet their desired level of risk. However, Wilson and Farrow emphasize the option of using a Bayesian analysis, giving special attention to this perspective. From the producer’s viewpoint, in an assurance approach, they consider their own probability distribution over the true reliability, leading to a more realistic assessment of the test’s risk. This approach allows the producer to incorporate their prior beliefs and historical data into the RDT design without imposing them on the test analysis. Similarly, the consumer’s beliefs are also considered through a separate analysis prior, accommodating variations in their perspective. This flexibility in incorporating different beliefs enhances the overall effectiveness and reliability of the RDT. The application of the assurance approach was demonstrated in calculating sample sizes for RDT with binomial and Weibull likelihoods, using suitable prior distributions for the test design and analysis. As an example, Figure 1 shows plots of the sample size n against the assurance for three approaches. The binomial test is shown by the solid line, the skeptical prior (conservative beliefs for the consumer) by the dashed line and the mixture prior by the dotted line. The mixture prior and the binomial test give the highest assurance for any particular sample size and the skeptical prior the lowest assurance.

Case Study: Weibull RDT of Pressure Vessels
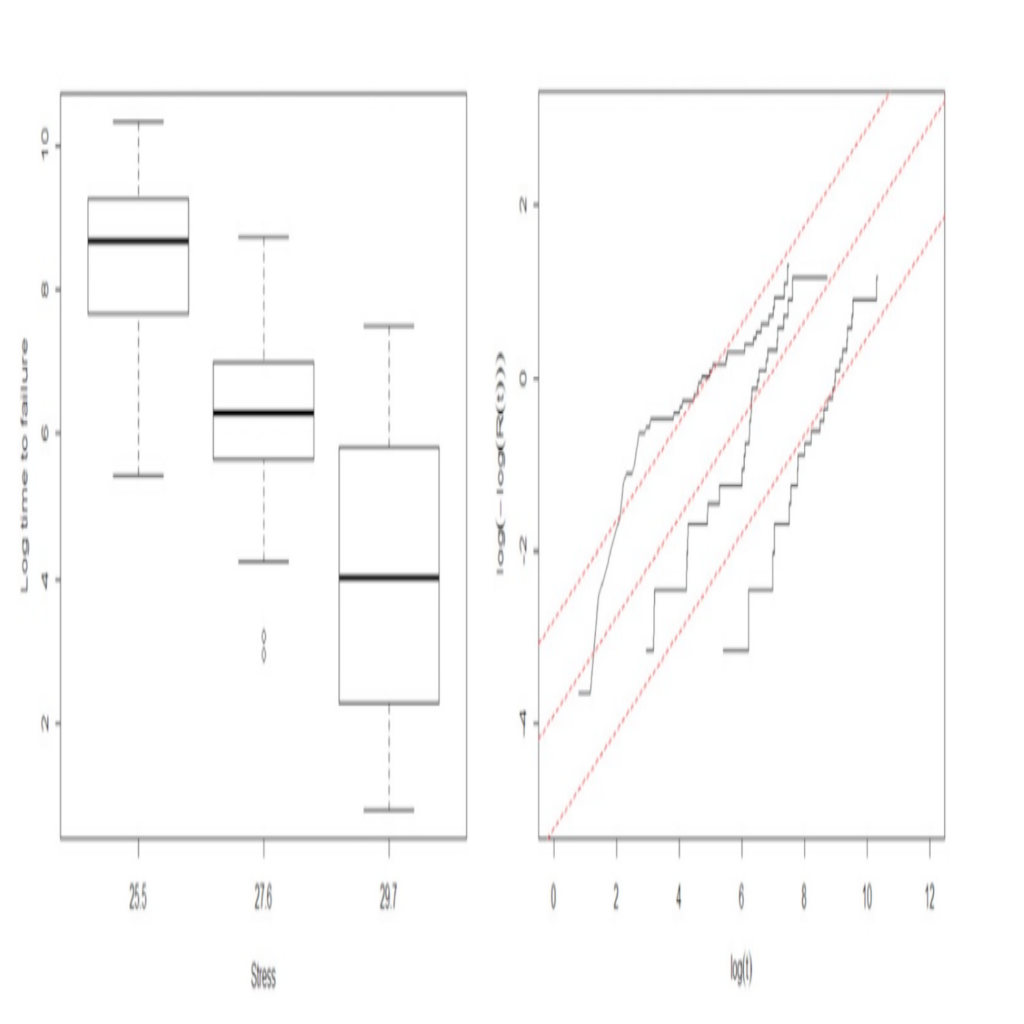
Hamada et al. (2008) presented the time to failure (in hours) of 87 pressure vessels wrapped in Kevlar-49 fibers under three different stress levels: 25.5, 27.6, and 29.7 MPa. The boxplots of the natural logarithm of the failure times by stress level are shown in Figure 2, describing strong differences among the distributions of failure time under different pressures.

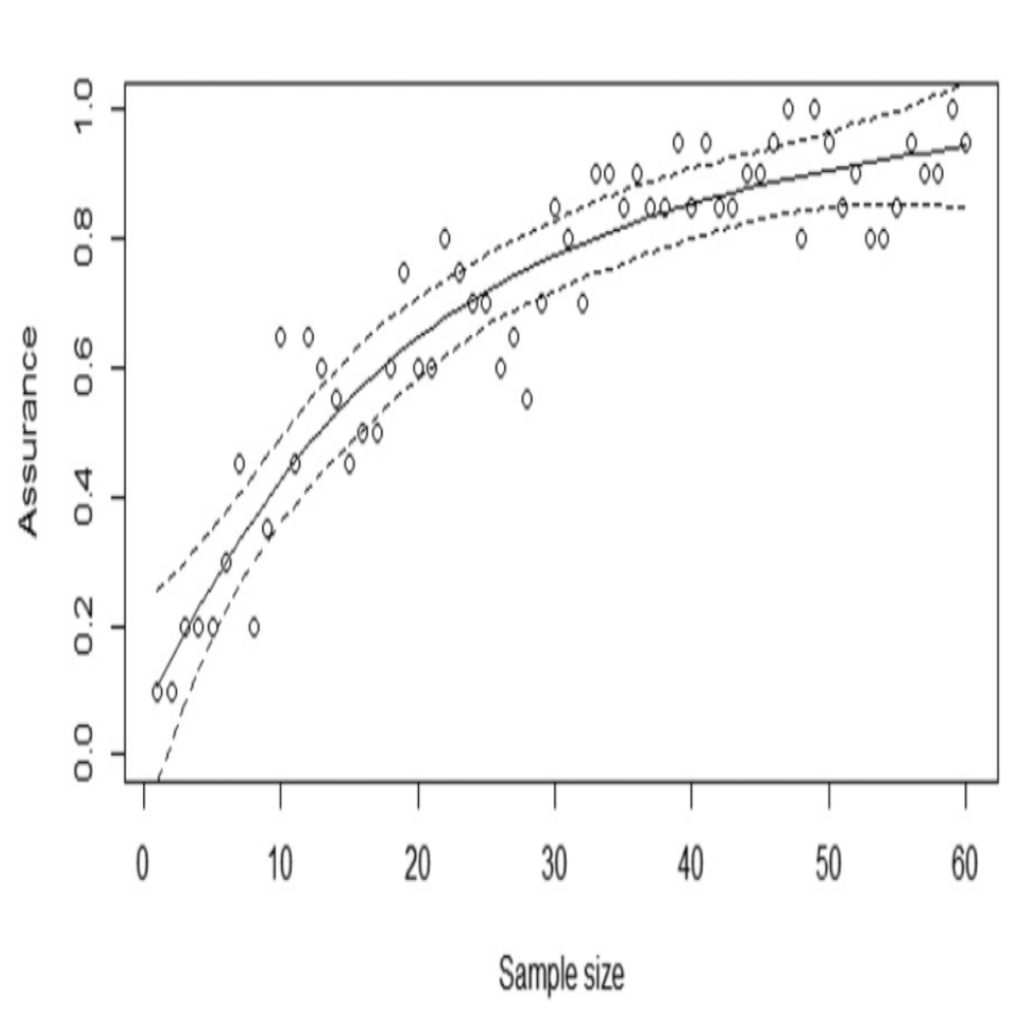
Figure 5 also depicts Weibull probability plots for checking the Weibull model assumption and diagnostics under each pressure. Under the design posterior distribution, the assurance for various sample sizes is provided in Figure 3.

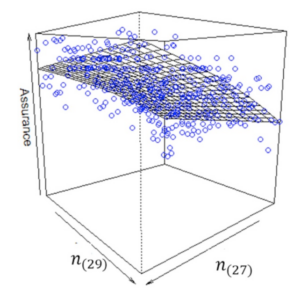
To produce the assurance curve, 60 values were chosen and the test criterion was evaluated 20 times for each value of the sample size. It demonstrates that one can achieve an assurance of more than 85% with sample sizes under 60 using the design posterior distribution. Now, let’s consider a pair of sample sizes (n(27), n(29)) for the number of vessels to test at 27 and 29 MPa, respectively. The assurance was evaluated using the curve fitting technique in two-dimensions for all combinations of these sample sizes. Figure 4 shows this surface and it demonstrates that an assurance of minimum 80% can be achieved by putting just 22 items on test, 20 at 27 MPa and 2 at 29 MPa. This is fewer than the 32 observations when using equal sample sizes between the two pressures!

Further Exploration of Assurance
Determination of adequate sample sizes for RDT in hardware products, specifically for failure on-demand and time-to-failure scenarios has been a challenging topic in the field of statistical reliability and quality assessments. The concept of assurance assesses the probability of achieving a successful outcome in RDT. Whether using frequentist or Bayesian analysis, assurance separates the specification of prior beliefs during the test design from the analysis afterward. Historical data can be also incorporated into the sample size calculation without influencing the test analysis. For this new concept, Wilson and Farrow provided comprehensive methods and guidance for specifying both design and analysis priors. Perhaps, developing user- friendly open-source software for practitioners, extending the assurance approach to other popular lifetime distributions, considering the optimal design problems, etc. would be the potential and much anticipated future works to be explored.
