Data Fission – Statistical Analysis through Data Point Separation
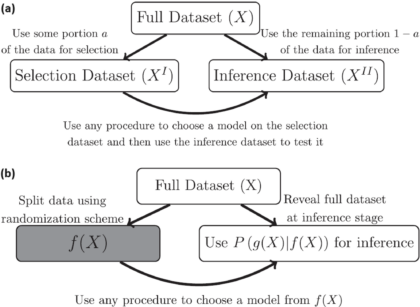
Title: Data Fission: Splitting a Single Data PointAuthors & Year: J. Leiner, B. Duan, L. Wasserman, and A. Ramdas (2023)Journal: Journal of the American Statistical Association[DOI:10.1080/01621459.2023.2270748]Review Prepared by David Han Why Split the Data? In statistical analysis, a common practice is to split a dataset into two (or more) parts, typically one for model development and the other for model evaluation/validation. However, a new method called data fission offers a more efficient approach. Imagine you have a single data point, and you want to divide it into two pieces that cannot be understood separately but can fully reveal the original data when combined. By adding and subtracting some random noise to create these two parts, each part contains unique information, and together they provide a complete picture. This technique is useful for making inferences after selecting a statistical model, allowing for better flexibility and accuracy compared to traditional data splitting…
Bridging the Gap between Models and Data
One of the key goals of science is to create theoretical models that are useful at describing the world we see around us. However, no model is perfect. The inability of models to replicate observations is often called the “synthetic gap.” For example, it may be too computationally expensive to include a known effect or to vary a large number of known parameters. Or, there may be unknown instrumental effects associated with variability in conditions during the data acquisition.
How Statistics Can Save Lives in a Pandemic
In responding to a pandemic, time is of the essence. As the COVID-19 pandemic has raged on, it has become evident that complex decisions must be made as quickly as possible, and quality data and statistics are necessary to drive the solutions that can prevent mass illness and death. Therefore, it is essential to outline a robust and generalizable statistical process that can not only help to diminish the current COVID-19 pandemic but also assist in the prevention of potential future pandemics.

