Beyond the Numbers – Why Causal Inference Needs More Than Statistics
Title: Causal Inference Is Not Just a Statistics ProblemAuthors & Year: McGowan, L.D., Gerke, T., and Barrett, M. (2024)Journal: Journal of Statistics and Data Science Education [DOI: 10.1080/26939169.2023. 2276446]Review Prepared by David Han Causality Is Not Obvious, Even with Good Data In Statistics 101, we learn that correlation does not imply causation. Truly understanding this is one of the trickiest challenges across all disciplines. Let’s start with a question: Does drinking coffee cause better exam performance? You might run a survey and find that students who drink more coffee tend to score higher. Great! Does this mean coffee helps you score better? Not so fast. What if more studious students are both more likely to drink coffee and more likely to study hard? In that case, it is not the coffee. It is their study habits. Or what if students drink coffee because they are stressed from cramming, and that…
The Power of Online Experiments – What Big Tech Can Teach Us About Testing Ideas
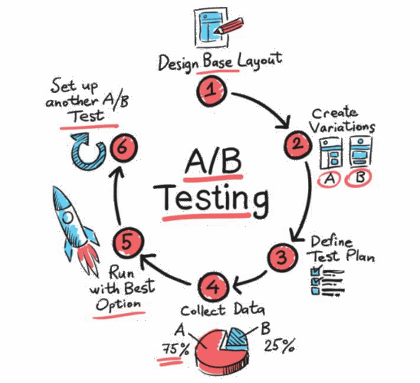
Article Title: Statistical Challenges in Online Controlled Experiments: A Review of A/B Testing Methodology Authors & Year: Larsen, N., Stallrich, J., Sengupta, S., Deng, A., Kohavi, R., Stevens, N.T. (2024) Journal: The American Statistician [DOI: 10.1080/00031305.2023.2257237]Review Prepared by David Han What’s an Online Experiment & Why Should We Care? Have you ever wondered how Netflix decides what thumbnails to parade on your screen, or how Amazon chooses what items to nudge into your recommendations? Behind the scenes, many of these choices come from something known as A/B testing, a type of experiment that companies rely on to make smart, data-driven decisions. Picture this: After creating two versions of a webpage, you deploy each site to separate groups of users online. You then patiently wait to see which one performs better – say, attracting more clicks or garnering more purchases. This is an A/B test in action. In the tech world,…
Generative A.I. in SPC: Unlocking New Potential while Tackling the Risks
Title: How generative AI models such as ChatGPT can be (mis)used in SPC practice, education, and research? An exploratory studyAuthors & Year: Megahed, F.M., Chen, Y.J., Ferris, J.A., Knoth, S., and Jones-Farmer, L.A. (2023)Journal: Quality Engineering [DOI:10.1080/08982112.2023.2206479]Review Prepared by David Han Statistical Process Control (SPC) is a well-established statistical method used to monitor and control processes, ensuring they operate at optimal levels. With a long history of application in manufacturing and other industries, SPC helps detect variability and maintain consistent quality. Tools like control charts play a central role in identifying process shifts or trends, allowing timely interventions to prevent serious defects. Megahed, et al. (2023) explores how generative AI, particularly ChatGPT, can enhance the efficiency of SPC tasks by automating code generation, documentation, and educational support. While AI shows promise for routine tasks, the study also highlights its limitations in handling more complex challenges. For instance, ChatGPT’s misunderstanding of…
Data Fission – Statistical Analysis through Data Point Separation
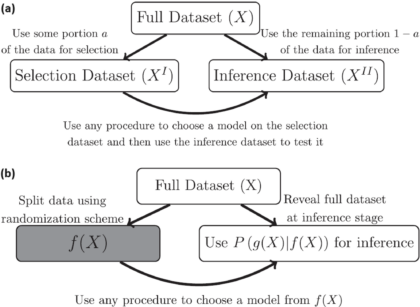
Title: Data Fission: Splitting a Single Data PointAuthors & Year: J. Leiner, B. Duan, L. Wasserman, and A. Ramdas (2023)Journal: Journal of the American Statistical Association[DOI:10.1080/01621459.2023.2270748]Review Prepared by David Han Why Split the Data? In statistical analysis, a common practice is to split a dataset into two (or more) parts, typically one for model development and the other for model evaluation/validation. However, a new method called data fission offers a more efficient approach. Imagine you have a single data point, and you want to divide it into two pieces that cannot be understood separately but can fully reveal the original data when combined. By adding and subtracting some random noise to create these two parts, each part contains unique information, and together they provide a complete picture. This technique is useful for making inferences after selecting a statistical model, allowing for better flexibility and accuracy compared to traditional data splitting…
Unveiling the Dynamics of Human-AI Complementarity through Bayesian Modeling
Article Title: Bayesian modeling of human–AI complementarity Authors & Year: M. Steyvers, H. Tejeda, G. Kerrigan, and P. Smyth (2022) Journal: Proceedings of the National Academy of Sciences of the United States of America [DOI:10.1073/pnas.2111547119] Review Prepared by David Han Exploration of Human-Machine Complementarity with CNN In recent years, artificial intelligence (AI) and machine learning (ML), especially deep learning, have advanced significantly for tasks like computer vision and speech recognition. Despite their high accuracy, these systems can still have weaknesses, especially in tasks like image and text classification. This has led to interest in hybrid systems where AI and humans collaborate, focusing on a more human-centered approach to AI design. Studies show humans and machines have complementary strengths, prompting the development of frameworks and platforms for their collaboration. To explore this further, the authors of the paper developed a Bayesian model for image classification tasks, analyzing predictions from both humans…
The A.I. Doctor is In – Application of Large Language Models as Prediction Engines for Improving the Healthcare System
Predictive Healthcare Analytics
Physicians grapple with challenging healthcare decisions, navigating extensive information from scattered records like patient histories and diagnostic reports. Current clinical predictive models, often reliant on structured inputs from electronic health records (EHR) or clinician entries, create complexities in data processing and deployment. To overcome this challenge, a team of researchers at NYU developed NYUTron, an effective large language model (LLM)-based system, which is now integrated into clinical workflows at the NYU Langone Health System. Using natural language processing (NLP), it reads and interprets physicians’ notes and electronic orders, trained on both structured and unstructured EHR text. NYUTron’s effectiveness was demonstrated across clinical predictions like readmission (an episode when a patient who had been discharged from a hospital is admitted again), mortality (death of a patient), and comorbidity (the simultaneous presence of two or more diseases or medical conditions in a patient) as well as operational tasks like length of stay and insurance denial within the NYU Langone Health System. Reframing medical predictive analytics as an NLP problem, the team’s study showcases the capability of LLM to serve as universal prediction engines for diverse medical tasks.
Differential Privacy Unveiled – the Case of the 2020 Census for Redistricting and Data Privacy
Census statistics play a pivotal role in making public policy decisions such as redrawing legislative districts and allocating federal funds as well as supporting social science research. However, given the risk of revealing individual information, many statistical agencies are considering disclosure control methods based on differential privacy, by adding noise to tabulated data and subsequently conducting postprocessing. The U.S. Census Bureau in particular has implemented a Disclosure Avoidance System (DAS) based on differential privacy technology to protect individual Census responses. This system adds random noise, guided by a privacy loss budget (denoted by ϵ), to Census tabulations, aiming to prevent the disclosure of personal information as mandated by law. The privacy loss budget value ϵ determines the level of privacy protection, with higher ϵ values allowing more noise. While the adoption of differential privacy has been controversial, this approach is crucial for maintaining data confidentiality. Other countries and organizations are also considering this technology as well.
Assurance, a Bayesian Approach in Reliability Demonstration Testing for Quality Technology
Title: Assurance for Sample Size Determination in Reliability Demonstration Testing Authors & Year: Kevin Wilson & Malcolm Farrow (2021) Journal: Technometrics [DOI: 10.1080/00401706.2020.1867646] Why Reliability Demonstration Testing? Ensuring high reliability is critical for hardware products, especially those involved in safety-critical functions such as railway systems and nuclear power reactors. To build trust, manufacturers use reliability demonstration tests (RDT) where a sample of products is tested and failures are observed. If the test meets specific criteria, it demonstrates the product’s reliability. The RDT design varies based on the type of hardware product being tested, whether it is failure on demand or time to failure. Traditionally, sample sizes for RDT have been determined using methods that consider the power of a hypothesis test or risk criteria. Various approaches, such as Bayesian methods and risk criteria evaluation, have been developed over the decades in order to enhance the effectiveness of RDT. These measures…
An Introduction to Second-Generation p-Values
For centuries, the test of hypotheses has been one of the fundamental inferential concepts in statistics to guide the scientific community and to confirm one’s belief. The p-value has been a famous and universal metric to reject (or not to reject) a null hypothesis H0, which essentially denotes a common belief even without the experimental data.
New Methods for Calculating Confidence Intervals
For statistical modeling and analyses, construction of a confidence interval for a parameter of interest is an important inferential task to quantify the uncertainty around the parameter estimate. For instance, the true average lifetime of a cell phone can be a parameter of interest, which is unknown to both manufacturers and consumers. Its confidence interval can guide the manufacturers to determine an appropriate warranty period as well as to communicate the device reliability and quality to consumers. Unfortunately, exact methods to build confidence intervals are often unavailable in practice and approximate procedures are employed instead.


![Flow chart showing the steps of the LLM approach for clinical prdeiction. The top left is part a with a Lagone EHR box connected to 2 boxes, NYU Notes(clinical notes) and NYU Fine-Tuning (clinical notes and task specific labels). The top right is the pret-training section with NYU notes (clinical notes) in the far top right connected to a language model box which then connects to a larger masked language model box below it (fill in [mask]: a 39-year-old [mask] was brough in by patient (image representing llm replying) patient)). The bottom left has nyu fine tuning (clinical notes and task specific tasks) in the top right of its quadrant connected to a pretrained model box which connects down to a larger fine-tuning box, specifically the predicted p(label) ground truth pair (0.6, 0.4) which connects to a small box inside the big on lageled loss which goes to another small box labeled weight update which goes back to the pretrained model box. The last quadrant in the bottom right has two boxes on the left of fine-tuned model and hospital ehr(clinical notes) connected to inference engine in the top right of the quadrant that connects down to the email alert (physician) box](https://mathstatbites.org/wp-content/uploads/apollo13_images/msbHanNyu1-7ipft2sg6himqf4p6irp5l74aclvk4e4w6.png)